Population Genetics
Theoretical and empirical analyses of how demographic and evolutionary processes influence neutral and adaptive genetic variation within populations.


Semester course; 3 lecture hours. 3 credits. Prerequisite: STAT 543 or BIOS 543 or ENVS 543 or FRSC 580. Theoretical and empirical analyses of how demographic and evolutionary processes influence neutral and adaptive genetic variation within populations.
Population genetics is concerned with understanding the mechanisms that influence the movement of genetic material through space and time. To understand the operation of evolution itself, you must have a working knowledge of population genetics. It is, so to speak, where the rubber meets the road, and the concepts contained within the field of population genetics have relevance to other sub-disciplines such as population biology, population ecology, evolutionary biology, evolutionary ecology, conservation genetics, landscape genetics, and forensic science.
The field of population genetics has a history marked by periods of intense interest, interspersed with periods of stagnation. Despite, or perhaps due to, the isochronal development in the theory underlying this field, the foundations laid down by Fisher, Haldane, and Wright during the early decades of the 20th century continue to influence empirical validation.
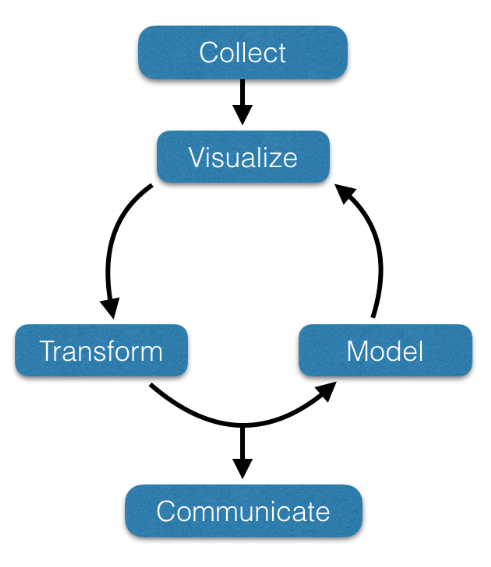
Workflows in Population Genetics
To understand data analysis in population genetics, we should recognize a generic iterative workflow, as depicted below.
- Collecting data from an external source into a usable format is often the most time-consuming step in the analysis. The content of this class will provide training in data import from local, online, and database sources.
- Visualize: Visualizing data is key to understanding. In the image below, notice that the variables X and Y in all the displayed data sets have equivalent means, standard deviations, and correlation up to 2 decimal places! We will emphasize visualization, both static and dynamic, throughout this class.
- Transform: More than pulling data into your analysis ecosystem is required. Often, the data needs to be reformatted and reconfigured before it is usable.
- Model: Applying models to subsets of data is often the step that takes the least time and effort. However, applying a model to data is not the endpoint. The model must be visualized, and, often, the underlying data or derived data must be transformed and submitted to subsequent models.
- Communicate: The effort we put into research and analysis is only possible when we effectively communicate our data and findings to a broad audience. Here, we will focus on developing effective data communication strategies and formats.
Course Learning Objectives
This course aims to help you develop your data skills and a foundational understanding upon which subsequent courses will build. The overarching goal is to create a working knowledge of the R statistical computing language and enough proficiency to import raw data and then iterate through the visualization, manipulation, and analysis steps to create output that is easily communicated to a scientific audience.
The content of this course is built upon the following general student learning objectives (SLO):
- Evolutionary Consequences of Population Genetic Processes: Explain how evolutionary processes (e.g., drift, selection, mutation, migration) influence genetic diversity and structure and predict their theoretical effects on populations, with applications to real-world biological and forensic scenarios.
- Applied Population Genetic Analysis: Execute population genetic analyses using R by manipulating datasets, troubleshooting workflows, and interpreting results to make data-driven inferences about genetic diversity and structure in real populations.
- Evidence-Based Communication of Genetic Analyses: Generate scientifically accurate and visually compelling representations of population genetic results in formats tailored to diverse audiences, highlighting key findings and their implications.
Schedule of Modules
This course is partitioned into independent learning modules focusing on a specific microevolutionary process. These are self-contained and will include all the content necessary to introduce the evolutionary process itself, some background information on the process or processes, a longer narrative document with data and worked examples in R, and an in-class activity for group work. There will be at least one assessment for each of these topics.
Course Topics
- R Ecosystem:
- Review of data types, containers, graphics, and markdown.
- Single Population Processes:
- Hardy-Weinberg Equilibrium
- Genetic Drift & Mutation
- Diversity & Rarefaction
- Effective Population Size
- Non-Random Mating:
- Selfing & Mixed Mating Systems
- Wahlund Effects
- Forensic Genetics:
- Pedigree Analysis
- Parentage & Forensic Matching
- Subdivided Populations:
- Population Models
- Genetic Distance & Isolation
- Genetic Structure
- Selection:
- Selection
- Quantitative Genetics
Graded Components
This course has the following components.
In-Class: All in-class activities will be treated as group work. On occasion, this material will be turned in, though it is intended to serve mostly as in-person practice activities.
Homework: Homework assignments will be conducted in R. Depending on the module, you may be asked to submit your work online (as R code or as a Markdown document) OR as a physical document. A rubric will be provided.
Synthesis: At the end of the course, you will individually perform a larger synthetic analysis of a provided data set. You will be asked to analyze the data and discuss salient population genetic characteristics of the data set.
I will give you sufficient time to complete these items. Science is not done by "sitting in a room and taking an exam."
Without prior approval or extenuating medical-related emergencies, I will not accept any late Homework or Synthesis items; you will receive 0 points. A key will be released for all turned-in content the moment it is due, so you can see how I would have answered the question(s).
Grading & Evaluations
The grade for this course is based upon the totality of the points gained for all assignments, as well as a single large data analysis project that will be due at the end of the semester. This final will account for 10% of your overall grade. Grades will be determined using the normal 10% scale:
- A (>= 90%),
- B (>= 80% & < 90%),
- C (>= 70% & < 80%),
- D (>= 60% & < 70%), and
- F (< 60%).
All percentages are concrete, scores will be rounded to the nearest integer, and no extra credit will be given.
VCU Syllabus Statement
Students should visit http://go.vcu.edu/syllabusLinks to an external site. and thoroughly review all of the listed syllabus statement information. The full university syllabus statement includes information such as safety, registration, the VCU Honor Code, student conduct, withdrawal from courses, and more.