Environmental Data Literacy
Developing quantitative analysis skills for data visualization, manipulation, analysis, and communication using the R statistical language.

Semester course; 3 lecture hours. 3 credits. Enrollment is restricted to students with graduate standing or those with one course in statistics and permission of instructor. Develop quantitative skills for the visualization, manipulation, analysis, and communication of environmental "big data." This course focuses on spatial environmental data analysis, interpretation, and communication, using real-time data from the Rice Rivers Center and the R statistical analysis environment.
As both a student and instructor in statistics classes, I found I spent a vast amount of time and effort describing the characteristics of statistics (derivations, expectations, etc.). These skills do not translate into a skillset that allows you, as a graduate student, to apply statistical analyses to real-world data sets in an efficient manner. This course is not about statistics per se; it is about data: how to collect it, how to visualize it, how to work with and manipulate it, how to apply standard analysis models to it, and how to communicate about data.
Workflow in Data Analysis
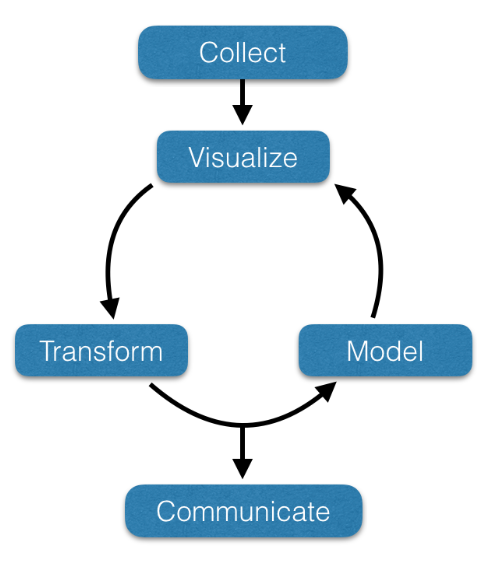
Below is a brief graphical depiction of how analysis works in the real world. In this class, we will work on all of these components using the open-source R language.
- Collecting data from an external source into a usable format is often the most time-consuming step in the analysis. The content of this class will provide training in data import from local, online, and database sources.
- Visualize: Visualizing data is key to understanding. In the image above, notice that the variables X and Y in all the displayed data sets have equivalent means, standard deviations, and correlation up to 2 decimal places! We will emphasize visualization, both static and dynamic, throughout this class.
- Transform: Pulling data into your analysis ecosystem is not sufficient. Often, the data needs to be reformatted and reconfigured before it is usable—wait until we get to date, time, and space calculations...
- Model: Applying a model to a dataset is often the quickest process, though often not the end result. Models are subsequently validated and visualized, and often, the output must be transformed and submitted as input to subsequent models.
- Communicate: The effort we put into research and analysis is meaningless without effective communication of your data and findings to a broad audience.
Course Learning Objectives
The overarching goal is to create a working knowledge of the R statistical computing language and sufficient proficiency to import raw data and then iterate through the visualization, manipulation, and analysis steps in creating output that is easily communicated to a scientific audience.
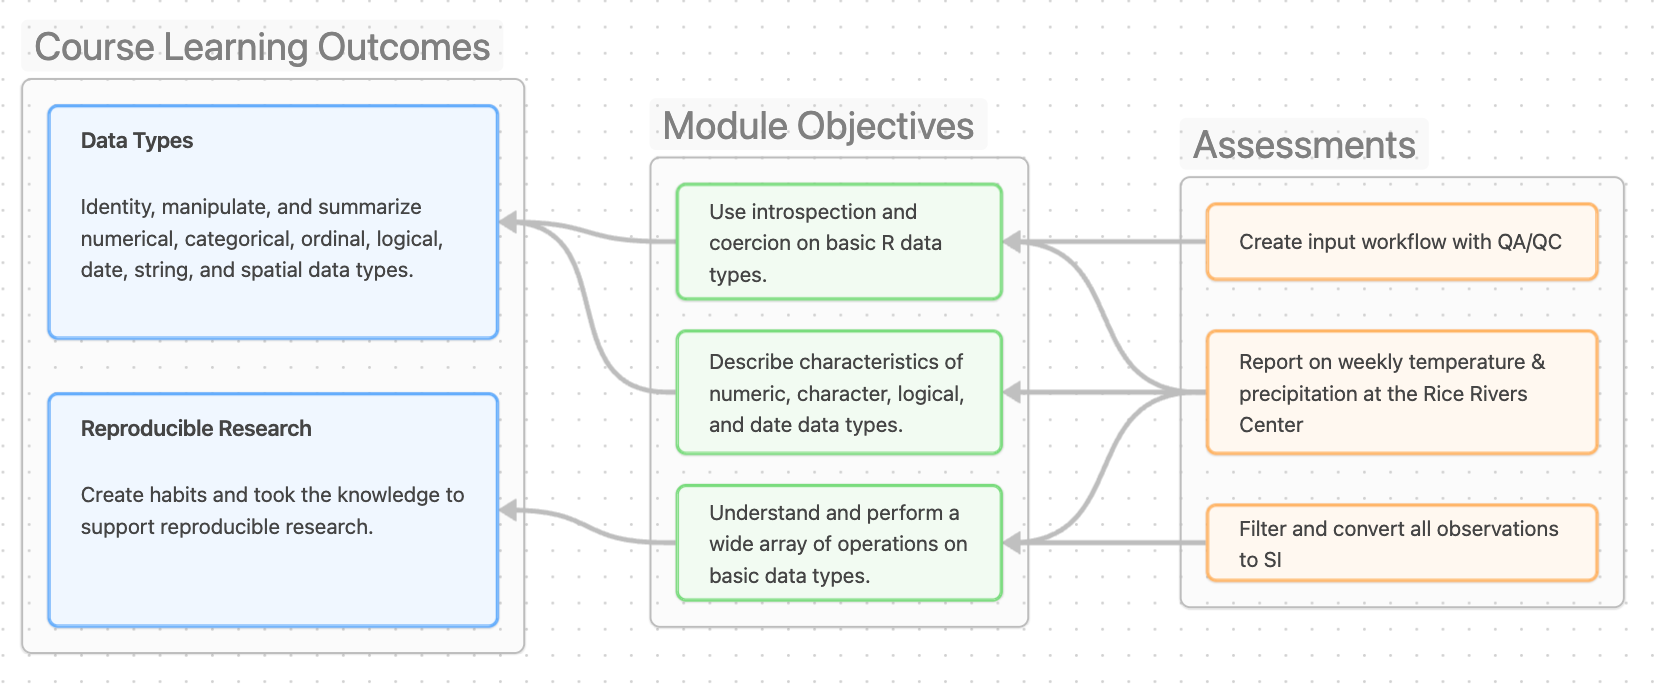
The content of this course is built upon concrete learning objectives for the course, hereafter Course Learning Objectives (CLO), which map onto the academic program learning outcomes for the graduate degrees in Environmental Studies. Each learning module is similarly configured with Module Learning Objectives that map onto at least one CLO, adopting a Backwards Design Approach.
This class has the following three Course-level Learning Objectives.
Use R to perform reproducible data analysis workflows across environmental contexts
Students will demonstrate functional fluency in using R and its associated libraries (e.g., Tidyverse, Quarto) for data import, transformation, visualization, and analysis, establishing a generalizable skillset for quantitative inquiry.
- Bloom's Level: Apply / Analyze
- Reinforces: Seeing R as a tool for thinking and doing, not just syntax or statistical analysis
- Notes: This aligns with the practical literacy needed to "think with data" in a coding environment. It emphasizes generalized fluency over memorization or syntax drills.
Analyze and interpret commonly encountered environmental data and associated analyses using appropriate exploratory and statistical techniques
Students will apply foundational exploratory and statistical approaches (e.g., binomial models, contingency tables, regression, spatial summaries) to common ecological, environmental, and evolutionary datasets to support data-driven inference.
- Bloom's Level: Analyze / Evaluate
- Reinforces: Judgment in data workflows, including exploratory iteration and critique.
- Notes: This keeps the emphasis on doing the analysis and interpreting results, not on statistical derivation of model components. It fits the framing: "not a stats class" but "using common tools to make sense of real data." It also creates space for iteration and model refinement, aligning with the "model, visualize, refine" approach.
Communicate data-driven findings using publication-quality scientific writing and visualizations.
Students will produce clear, compelling, and reproducible documents that communicate quantitative findings, formatted according to scientific norms and using tools like Quarto and Markdown.
- Bloom's Level: Create
- Reinforces: Scientific communication and agile presentation of quantitative and qualitative information in industry-standard formats.
- Notes: This grounds communication in scientific practice, where students must compose and format their insights clearly and rigorously. It ties tightly into how you assess work ("as if submitting for publication") and emphasizes narrative data fluency, not just procedural results.
Course Content & Assessment
This course is designed as a set of sequential learning modules–each of which builds upon the mastery of previous modules. Every module is self-contained and includes specified learning objectives, supporting learning assets such as a topic narrative, slides, external resources salient to the topic, and a set of assessments so you can demonstrate your mastery of the module's topic. All assessments will have clear objectives and rubrics.
- Welcome & Logistics: Setting up the logistics for the class, installing R, RStudio, and Quarto on each of your computers, and providing a tour of the IDE.
- Markdown: Establish a functional working knowledge of how to use Markdown as a tool for merging data, analyses, and narrative in scientific communication.
- Base Data Types & Containers: Understanding the fundamental data types and containers within R and how to import, work with, and export raw data.
- Basic Data Visualization: What do these data look like? Quick and dirty visualization techniques to begin understanding data qualities.
- Spatial Data Types: Use vector and raster data types to describe spatially relevant information.
- Tidyverse: Data manipulation—like a boss.
- Graphics That DON'T Suck: Hello, publication-quality graphics, using the grammar of graphics approach.
- Statistical Confidence: Base understanding of statistical inferences and the properties of sampled data.
- Non-parametric Inferences: Analyses based upon expectations.
- Categorical~f(Categorical): Contingency table and categorical count data.
- Continuous~f(Categorical): Analysis of Variance (or equality of means).
- Continuous~f(Continuous): Correlation & Regression approaches.
- Categorical~f(Continuous): Logistic regression.
- Spatial Analyses: Performing spatially explicit analyses of point processes and habitats.
Logistics
- Course Instructor: Professor Rodney Dyer
- Email: rjdyer@vcu.edu
- Webpage: rodneydyer.com.
- Office Hours: Wednesdays from 10-11 am via Zoom or by appointment.
Required Materials
This course requires that you bring a laptop capable of running RStudio and the R statistical language. There is no required book, and all content is provided via online resources.
Assignments & Grading Policy
The grade for this course is based upon the totality of the points gained for all assignments, as well as a single large data analysis project that will be due at the end of the semester. This final will account for 10% of your overall grade. Grades will be determined using the normal 10% scale:
- A (>= 90%),
- B (>= 80% & < 90%),
- C (>= 70% & < 80%),
- D (>= 60% & < 70%), and
- F (< 60%).
All percentages are concrete, scores will be rounded to the nearest integer, and no extra credit will be given.
Late Policy
All of the content in this class is given as take-home assignments and tests. You will have a full seven days to complete and submit the work. The intention here is to provide you with more than sufficient time to complete the task. We do not rush data analysis, and no practitioner sits in a room with a clock over their shoulder telling them to hurry up. That said, you must not put off doing the work until the end; it may take some iteration (see image above).
On the due date for each deliverable, I will post the answers so you can check your work. After the answers are posted, no points will be awarded for late work.
If you have an emergency, sickness, or professional reason to be missing a week's worth of class (e.g., presentations at a scientific meeting, etc.), please let me know beforehand so we can work out a solution.
Attendance Policy
All content is provided in the form of slides, handouts, and video content. Much of the work in this class will be conducted during the in-class session. As such, you must attend the class session if you intend to receive the content. Data analysis is a hands-on experience, and the more you do it, the more efficient you will become.
Disclaimer
Note that the specifics of this Course Syllabus may be changed at any time during the semester. You will be responsible for abiding by any such changes that are communicated to you via email, course announcement, and/or posting in the course discussion forums.
VCU University Policies
Students should visit http://go.vcu.edu/syllabus and thoroughly review all of the listed syllabus statement information. The whole university syllabus statement includes information such as safety, registration, the VCU Honor Code, student conduct, withdrawal from courses, and more.